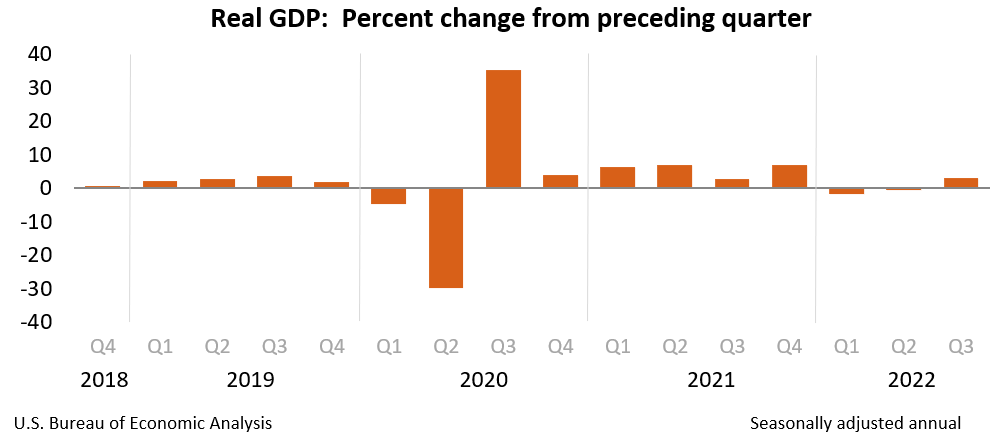
WASHINGTON — Real gross domestic product (GDP) increased at an annual rate of 2.9 percent in the third quarter of 2022 (table 1), according to the “second” estimate released by the Bureau of Economic Analysis. In the second quarter, real GDP decreased by 0.6 percent.
The GDP estimate released today is based on more complete source data than was available for the “advance” estimate issued last month. In the advance estimate, the increase in real GDP was 2.6 percent. The second estimate primarily reflected upward revisions to consumer spending and nonresidential fixed investment that were partly offset by a downward revision to private inventory investment. Imports, which are a subtraction in the calculation of GDP, decreased more than previously estimated (refer to “Updates to GDP”).
The real GDP increase reflected exports, consumer spending, nonresidential fixed investment, state and local government spending, and federal government spending, which were partly offset by decreases in residential fixed investment and private inventory investment. Imports decreased (table 2).
The increase in exports reflected increases in both goods and services. Within exports of goods, the leading contributors to the increase were industrial supplies and materials (notably nondurable goods), “other” exports of goods, and nonautomotive capital goods. Within exports of services, the increase was led by travel and “other” business services (mainly financial services).
Within consumer spending, an increase in services (led by health care and “other” services) was partly offset by a decrease in goods (led by motor vehicles and parts as well as food and beverages). Within nonresidential fixed investment, increases in equipment and intellectual property products were partly offset by a decrease in structures. The increase in state and local government spending was led by increased compensation of state and local government employees and investment in structures. The increase in federal government spending was led by defense spending.
New single-family construction and brokers’ commissions led a decrease in residential fixed investment. Within private inventory investment, the decrease was led by retail trade (mainly clothing and accessory stores as well as “other” retailers). Within imports, a decrease in imports of goods (notably consumer goods) was partly offset by an increase in imports of services (mainly travel).
Real GDP increased in the third quarter, increasing 2.9 percent after decreasing 0.6 percent in the second quarter. The upturn primarily reflected a smaller decrease in private inventory investment, an acceleration in nonresidential fixed investment, and upturns in federal and state and local government spending that were partly offset by a larger decrease in residential fixed investment and a deceleration in consumer spending. Imports turned down.
Current‑dollar GDP increased 7.3 percent at an annual rate, or $450.5 billion, in the third quarter to a level of $25.7 trillion (table 1 and table 3), an upward revision of $35.7 billion from the previous estimate. More information on the source data that underlie the estimates is available in the “Key Source Data and Assumptions” file on BEA’s website.
The price index for gross domestic purchases increased 4.7 percent in the third quarter (table 4), an upward revision of 0.1 percentage point from the previous estimate. The PCE price index increased 4.3 percent, an upward revision of 0.1 percentage point. Excluding food and energy prices, the PCE price index increased 4.6 percent and revised 0.1 percentage point.
Personal Income
- Current-dollar personal income increased $291.3 billion in the third quarter, an upward revision of $0.1 billion from the previous estimate. The increase primarily reflected increases in compensation (led by private wages and salaries) and personal interest income (table 8).
- Disposable personal income increased $235.8 billion, or 5.2 percent, in the third quarter, a downward revision of $32.6 billion from the previous estimate. Real disposable personal income increased 0.9 percent, a downward revision of 0.8 percentage point.
- Personal saving was $520.6 billion in the third quarter, a downward revision of $67.6 billiion from the previous estimate. The personal saving rate—personal saving as a percentage of disposable personal income—was 2.8 percent in the third quarter, a downward revision of 0.5 percentage point.
- Gross Domestic Income and Corporate Profits
- Real gross domestic income (GDI) increased 0.3 percent in the third quarter compared to a decrease of 0.8 percent in the second quarter (revised). The average of real GDP and real GDI, a supplemental measure of U.S. economic activity that equally weights GDP and GDI, increased 1.6 percent in the third quarter, in contrast to a decrease of 0.7 percent (revised) in the second quarter (table 1).
- Profits from current production (corporate profits with inventory valuation and capital consumption adjustments) decreased $31.6 billion in the third quarter, in contrast to an increase of $131.6 billion in the second quarter (table 10).
- Profits of domestic financial corporations decreased $32.9 billion in the third quarter, compared with a decrease of $46.0 billion in the second quarter. Profits of domestic nonfinancial corporations increased $6.1 billion, compared with an increase of $152.2 billion. Rest-of-the-world profits decreased $4.7 billion, in contrast to an increase of $25.5 billion. In the third quarter, receipts increased $3.1 billion, and payments increased $7.8 billion.
Updates to GDP
With the second estimate, upward revisions to consumer spending, nonresidential fixed investment, state and local government spending, and exports were partly offset by downward revisions to private inventory investment, residential fixed investment, and federal government spending. Imports decreased more than previously estimated. For more information, refer to the Technical Note. For information on updates to GDP, refer to the “Additional Information” section that follows.
| Advance Estimate | Second Estimate | |
|---|---|---|
| (Percent change from preceding quarter) | ||
| Real GDP | 2.6 | 2.9 |
| Current-dollar GDP | 6.7 | 7.3 |
| Real GDI | … | 0.3 |
| Average of Real GDP and Real GDI | … | 1.6 |
| Gross domestic purchases price index | 4.6 | 4.7 |
| PCE price index | 4.2 | 4.3 |
| PCE price index excluding food and energy | 4.5 | 4.6 |
Updates to Second-Quarter Wages and Salaries
In addition to presenting updated estimates for the third quarter, today’s release presents revised estimates of second-quarter wages and salaries, personal taxes, and contributions for government social insurance, based on updated data from the Bureau of Labor Statistics Quarterly Census of Employment and Wages program. Wages and salaries are now estimated to have increased $132.5 billion in the second quarter, a downward revision of $50.4 billion. Personal current taxes are now estimated to have increased $43.0 billion, a downward revision of $9.4 billion. Contributions for government social insurance are now estimated to have increased $19.7 billion, a downward revision of $6.5 billion. With the incorporation of these new data, real gross domestic income is now estimated to have decreased 0.8 percent in the second quarter, a downward revision of 0.9 percentage point from the previously published estimate.
* * *
Next release, December 22, 2022, at 8:30 a.m. EST
Gross Domestic Product (Third Estimate)
Corporate Profits (Revised Estimate)
Gross Domestic Product by Industry
Third Quarter 2022
* * *
| Release Dates in 2023 | ||||
|---|---|---|---|---|
| Estimate | 2022 Q4 and Year 2022 |
2023 Q1 | 2023 Q2 | 2023 Q3 |
| Gross Domestic Product | ||||
| Advance Estimate | January 26, 2023 | April 27, 2023 | July 27, 2023 | October 26, 2023 |
| Second Estimate | February 23, 2023 | May 25, 2023 | August 30, 2023 | November 29, 2023 |
| Third Estimate | March 30, 2023 | June 29, 2023 | September 28, 2023 | December 21, 2023 |
| Gross Domestic Product by Industry | March 30, 2023 | June 29, 2023 | September 28, 2023 | December 21, 2023 |
| Corporate Profits | ||||
| Preliminary Estimate | — | May 25, 2023 | August 30, 2023 | November 29, 2023 |
| Revised Estimate | March 30, 2023 | June 29, 2023 | September 28, 2023 | December 21, 2023 |
Click here for more Kentucky business news.