

Moved up 11 spots
LEXINGTON, Ky. (June 14, 2017) — Lexington ranks seventh among best cities for new college graduates, according to study by SmartAsset, a personal finance technology company headquartered in New York. Lexington was ranked 18th in 2016. Cincinnati was ranked No. 1 in this year’s study.
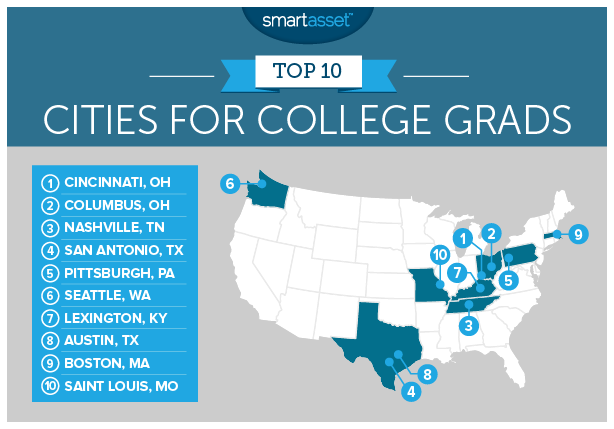 SmartAsset looked at the 108 largest cities in the U.S. and considered how each would suit a recent college grad, ranking cities based on how affordable, fun and job-friendly it is.
SmartAsset said of Lexington, “Residents with bachelor’s degrees are seeing more jobs this year, with the unemployment rate down by 2 percent, despite the drop in job postings. On average college grads are earning more than they were last year, as well.”
“Luckily, the rent remains affordable, landing Lexington in the top 25 in this metric overall,” said SmartAsset. “In fact, the overall cost of living is basically right at the national average, placing it as the 19th-best out of all the cities we looked at. That leaves you some nice space in your budget to head to the growing number of entertainment and dining businesses in the city. Plus, Lexington’s bars snagged the second-best Yelp scores in the top 10.”
Data & Methodology
- Jobs. Finding a job after college is an important part of where a new college grad might move. For the jobs metric, we took a look at the unemployment rate among those with bachelor’s degrees, the overall unemployment rate, earnings for college grads and the number of Indeed job listings. The bachelor’s degree unemployment rate and the earnings for college grads numbers come from the U.S. Census Bureau’s 2015 1 year American Community Survey (ACS). The overall unemployment rate comes from the Department of Labor’s Local Area Unemployment Statistics. The number of Indeed job postings comes from Indeed.com Job Search API.
- Affordability. The affordability of a city also plays a crucial part in a new college grad’s life. For this category, we looked at the median rent in each city and the cost of living as a percentage of the national average. The cost of living numbers come from the MIT living wage calculator. The median rent numbers come from the Census 2015 ACS.
- Fun. Fresh out of college life, new college grads are going to want to have fun in their new cities! For each city, we looked at the concentration of entertainment and dining, the percentage of the population ages 20-29 and the Yelp scores of restaurants and bars. The concentration of entertainment and dining businesses comes from the Census Zip Code Business Patterns and represents a percentage of all businesses. The population numbers come from the Census 2015 ACS. The Yelp scores come from Yelp.com API.
SmartAsset calculated the data for all the above metrics for each city. Then they ranked each city according to the metrics included in each category. They averaged the rankings of those metric scores across each of the three categories. For example, the most fun city would earn a score of 100, while the least fun would score 0. To find the overall index, they averaged the jobs, affordability and fun scores for each city.


Add Comment